Community Vis Model Information
The CommunityVis Model is an extension of ESRI’s ArcGIS Desktop software. CommunityVis uses Scenario Planning to model the future under different conditions and compare the tradeoffs between different scenarios or policy decisions. The metrics for each scenario are computed using dynamic calculations embedded in a spatial spreadsheet. The values of these formulas change according to user-input, or to reflect parameters that change as the model progresses.
The tool projects where future growth will occur based on current development and assumptions about what makes some locations more attractive than others. It can be used for a small area or an entire region. In the Research Triangle Region, an initial forecast of future growth to the Year 2040 was used to allocate growth for the region’s 2040 Metropolitan Transportation Plan. The model was refined to create Version 2.0 (TCV2), which was used for the 2045 Metropolitan Transportation Plan.
Each scenario compared has distinct input settings and outputs, but identical calculation rules. All scenarios contain the same map layers, static attributes, and formulas for dynamic attributes, assumptions, indicators and charts. Map features or values for dynamic attributes, assumptions, indicators, and charts may vary between scenarios.
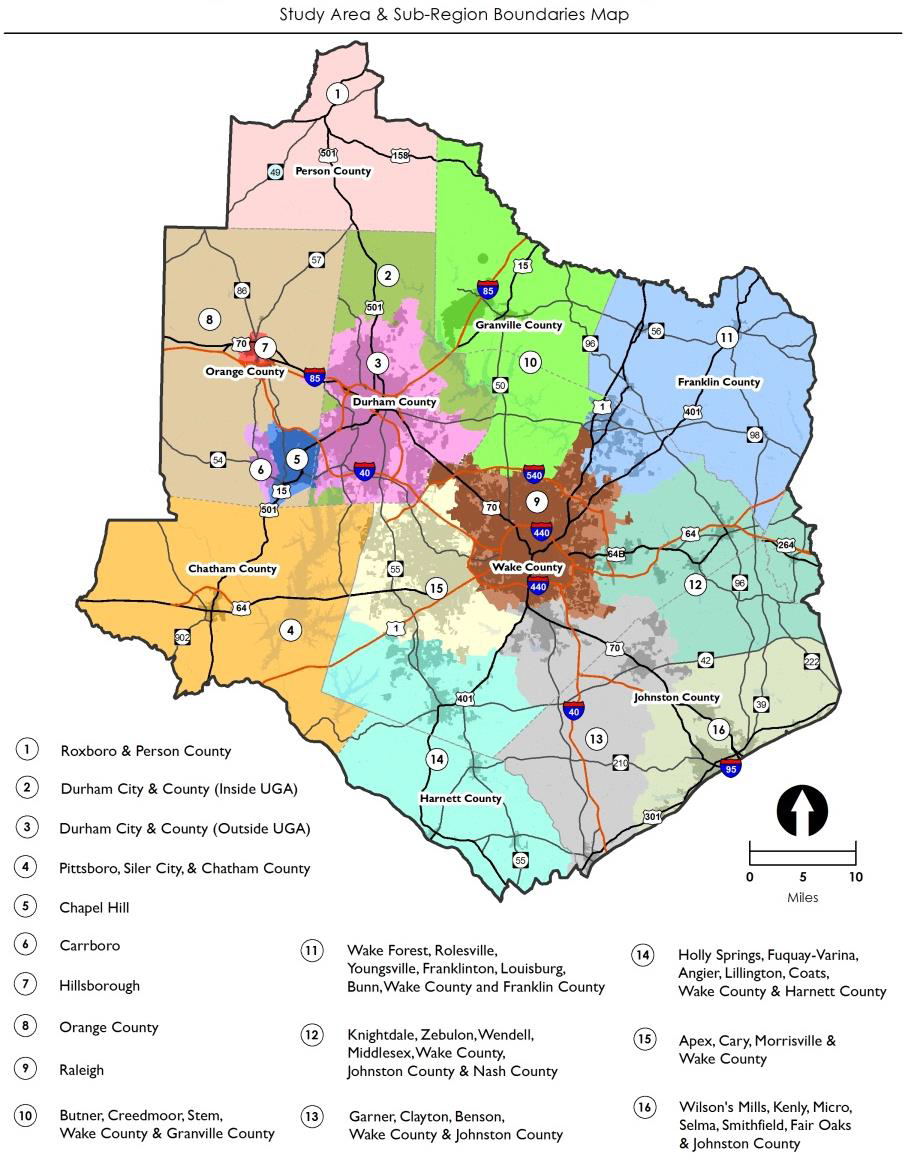
The area covered by this forecast is the “modeled area” of the Triangle Regional Model (TRM), which converts the CommunityVis forecasts into projections of future travel on area roadways and transit routes. The model consists of approximately 3,400 square miles. This region is broken into 16 sub-regions for computation efficiency and metric reporting. CommunityViz uses data from individual land parcels and assigns it to over 100,000 grid cells for analysis. These grid cell data are then translated into the 2,857 “traffic analysis zones” (TAZs), which are used in the TRM. The computational area of the CommunityVis can be seen below.
CommunityVis data requirements
1. The location of features that constrain development, such as water bodies, wetlands and stream buffers
2. The type of place each parcel is today and will become
3. The current development status of each parcel relative to its future use
4. The factors that will determine how attractive each parcel is for development, termed land suitability (decided regionally)
5. The types and amounts of growth that will be allocated, termed “growth targets” (decided regionally)
Development Constraints
Development constraints are special conditions that restrict the amount of development a parcel or grid cell can receive, even if the underlying parcel or grid cell might be undeveloped and zoned for development. The development constraint used in this version of CommunityViz is a Resource Conservation designation, which consists of water bodies, stream buffers, wetlands and permanent conservation areas where development is precluded.
Place Types
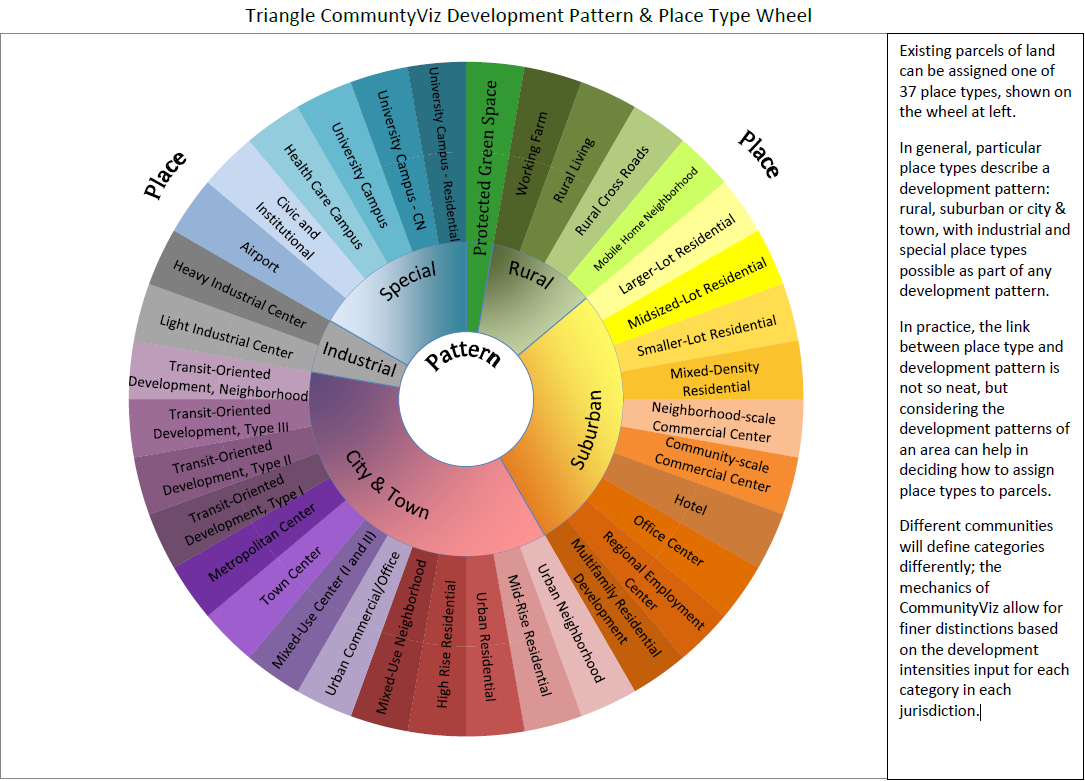
Each parcel of land is assigned one of 37 different CommunityViz place types spanning a range of residential, commercial, industrial and mixed-use development possibilities. Each place type in each jurisdiction is assigned a density or intensity measure designed to reflect the average value for that jurisdiction. Densities and intensities may be further modified by special conditions such as watershed protection or historic preservation designations. Residential place types include the % of land that is single family vs. multifamily. For mixed use place types, the designation includes the % of land that is residential and % of residential land that is multi-family. Place type may change over time.
Development Status
Parcels of land receive one of 5 development status assignments (excluding water, open space & agricultural designations):
- Developed: already built and cannot accept additional growth
- Committed or asserted: new growth manually assigned based on buildings under construction and anchor institution plans
- Undeveloped: can accept new growth up to the capacity of the place type
- Under-developed: can add development to what is already there (each parcel with this status will include a user-designated percentage of the parcel capacity that is already developed and cannot accept more growth)
- Re-developable: can accept new growth up to the capacity of the place type, but what is there now will be subtracted
Land Suitability
Land suitability is a measure of how “attractive” a parcel or grid cell is for new growth, relative to all the other parcels or grid cells in the county. TCV2.0 uses 14 different suitability factors, although some may not apply to a particular scenario (e.g. high frequency transit stations in a scenario without such service). A full list of factors, and the weights assigned to each factor in each scenario for TCV2.0, is available.
Growth Allocation & Growth Targets
The final step is to assign new growth to parcels or grid cells based on their relative suitability. Growth is based on control totals that are developed for each county, and for each of the 7 categories of growth that are forecast: Single-family residential units, Multi-family residential units, Office, Industrial, Retail, Service-high visitor rate, Service-low visitor rate.