Transportation Performance Measures
What is TPM?
A strategic approach that uses system information to make investment and policy decisions to achieve transportation system performance goals. For more detailed information, view this NCDOT presentation.
Background
The Capital Area MPO is required by federal law through the Moving Ahead for Progress in the 21st Century Act (MAP-21) and the Fixing America's Surface Transportation (FAST) Act to adopt 18 specific transportation performance measures. These measures are divided into four categories: Safety, Pavement/Bridge, System Performance, and Transit Assets.
The TPM process is integrated with the statewide and metropolitan transportation planning and programming process. MAP-21 and the FAST Act establish planning requirements for State DOTs, MPOs, and transit operators that integrate TPM with the adoption of STIPs/TIPs and Long-Range Transportation Plans (LRTPs) / Metropolitan Transportation Plans (MTP).
MPOs are required to establish performance targets for each of these measures on an annual basis by either:
- Agreeing to plan and program projects so that they contribute towards the accomplishment of the State DOT targets, or,
- Develop their own quantifiable targets for their metropolitan planning area by a methodology consistent with federal reporting requirements.
Public Transportation Agency Safety Plans
In addition to the performance measures outlined above, MPOs are required to develop regional performance measures and targets for Public Transportation Agency Safety Plans (PTASP). The National Safety Plan safety performance measures are:
- Fatalities
- Injuries
- Safety Events
- System Reliability (State of Good Repair)
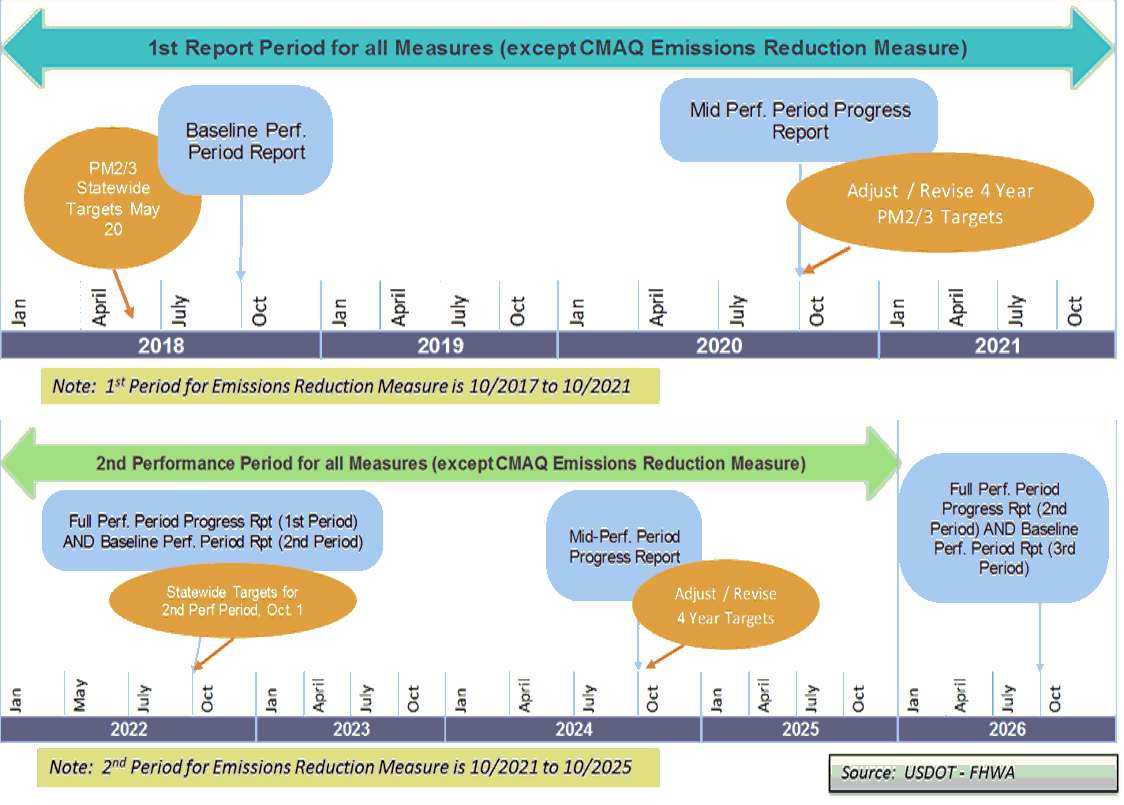
Ongoing TPM Process and Reporting
Measures
Safety Performance Measures 
- Number of fatalities
- Rate of fatalities (per 100 million Vehicle Miles Traveled - VMT)
- Number of serious injuries
- Rate of serious injuries (per 100 million VMT)
- Number of non-motorized fatalities and non-motorized serious injuries
Pavement/Bridge Performance Measures 

- Percent of pavements on the Interstate system in good condition
- Percent of pavements on the Interstate system in poor condition
- Percent of pavements on the non-Interstate National Highway System (NHS) in good condition
- Percent of pavements on the non-Interstate NHS in poor condition
- Percent of NHS bridges classified as in good condition
- Percent of NHS bridges classified as in poor condition
System Performance/Freight Performance Measures 
- Percent of person miles on the Interstate system that are reliable
- Percent of person miles on the non-Interstate NHS that are reliable
- Percent of Interstate mileage providing for reliable truck travel times
Transit Asset Management Performance Measures 
- Percent of vehicles that have met or exceeded their useful life
- Percent of non-revenue vehicles that have met or exceeded their useful life
- Percent of all equipment less than $50,000 with a condition rating below 3.0 on the federal Transit Economic Requirements (TERM) Scale
- Percent of all buildings or structures with a condition rating below 3.0 on the federal Transit Economic Requirements (TERM) Scale