2055 MTP Development - Archive
Developing the "Deficiency & Needs" Analysis
A Deficiency Analysis compares today’s travel conditions with that of a future year. It shows staff, the MPO Executive Board and the broader community where transportation investments in highways, transit and other modes are needed to address the future mobility demands. It helps to set a baseline that is used in the development and evaluation of the various transportation alternatives that will be considered in a subsequent step of the 2055 MTP development. This year, CAMPO's GIS and Mapping team built a comprehensive and interactive mapping tool for exploring the data of the deficiency and needs scenario. This mapping tool includes some maps not included in the static PDF maps. Please review the following chart to understand what maps you can access in the interactive map:
Results & Maps
Travel Times - Current Conditions (2020)
Travel Times - 2055 Forecast - Existing Conditions + Committed Projects
Congestion "Tomato Maps" - Current Conditions (2020)
Congestion "Tomato Maps" - 2055 Forecast - Existing Conditions + Committed Projects
Background on Deficiency Analysis
Years used in Analysis
The measures and maps are based on a travel demand model that estimates conditions in three different years:
- 2020 Base Year - This is 2020 population and employment using the existing transportation system of streets, transit, etc., and reflects the current travel conditions.
- 2029 Existing + Committed - This is the 2029 transportation system of streets, transit, etc., and reflects the existing transportation system plus any projects committed to construction or implementation by 2029.
- 2055 Growth - This is the estimated growth in population and employment through the year 2055 that uses the Existing + Committed transportation system. While somewhat unrealistic, an analysis of 2055 projected growth and its impact on a transportation system committed to be built by 2029 does help set a baseline for evaluating future mobility investments. This “no build” scenario allows us to see where future mobility deficiencies are to be expected.
Analysis Visualization
The results of the deficiency analysis is reviewed across several metrics. Congestion and Travel Time are two ways our region looks at mobility for a scenario. A variety of visualization techniques are used to illustrate these mobility metrics:
Congestion “Tomato Maps”
Congestion maps, commonly referred to as “Tomato Maps” are visualizations that depict levels of congestion on the roadway network. These maps show forecasted congestion on specific road segments and can show all day or specific times of day, typically CAMPO will show both peak period and off-peak times for comparison. These types of maps show a comparison of the anticipated volume to the designed capacity of the facility, also known as a “V/C ratio”. This ratio is traffic volume divided by the traffic capacity of the road segment. (For example, a volume of 9,000 vehicles on a road that is capable of carrying 10,000 vehicles will produce a V/C of 0.9).
Travel Time Maps
Travel time maps use isochrones, or “contours” to estimate the distance that can be traveled via travel “bands” of 20 minutes (0-20, 20-40, etc.). This analysis uses downtown Raleigh, downtown Durham and Raleigh-Durham International Airport (RDU) to show travel time during peak periods in the Deficiency Analysis scenario and illustrates corridor and small area mobility.
What is the Next Step?
With the MPO’s Goals and Objectives in mind, staff will use the deficiency data to create several alternatives to meet the future travel demand. This Alternatives Analysis is the next step after Deficiency Analysis in the development of the 2055 MTP and will be released in the coming months.
Developing the "Alternatives Analysis"
Plans and Trends - Vehicle Congestion - Daily Peak Period (2055)
Shared Leadership - Vehicle Congestion - Daily Peak Period (2055)
All Together - Vehicle Congestion - Daily Peak Period (2055)
Preferred - Vehicle Congestion - Daily Peak Period (2055)
The Alternative Future Scenarios Phase is nearing completion. The following explains the process that took place during that phase of analysis.
Alternatives Analysis – What are our Future Needs?
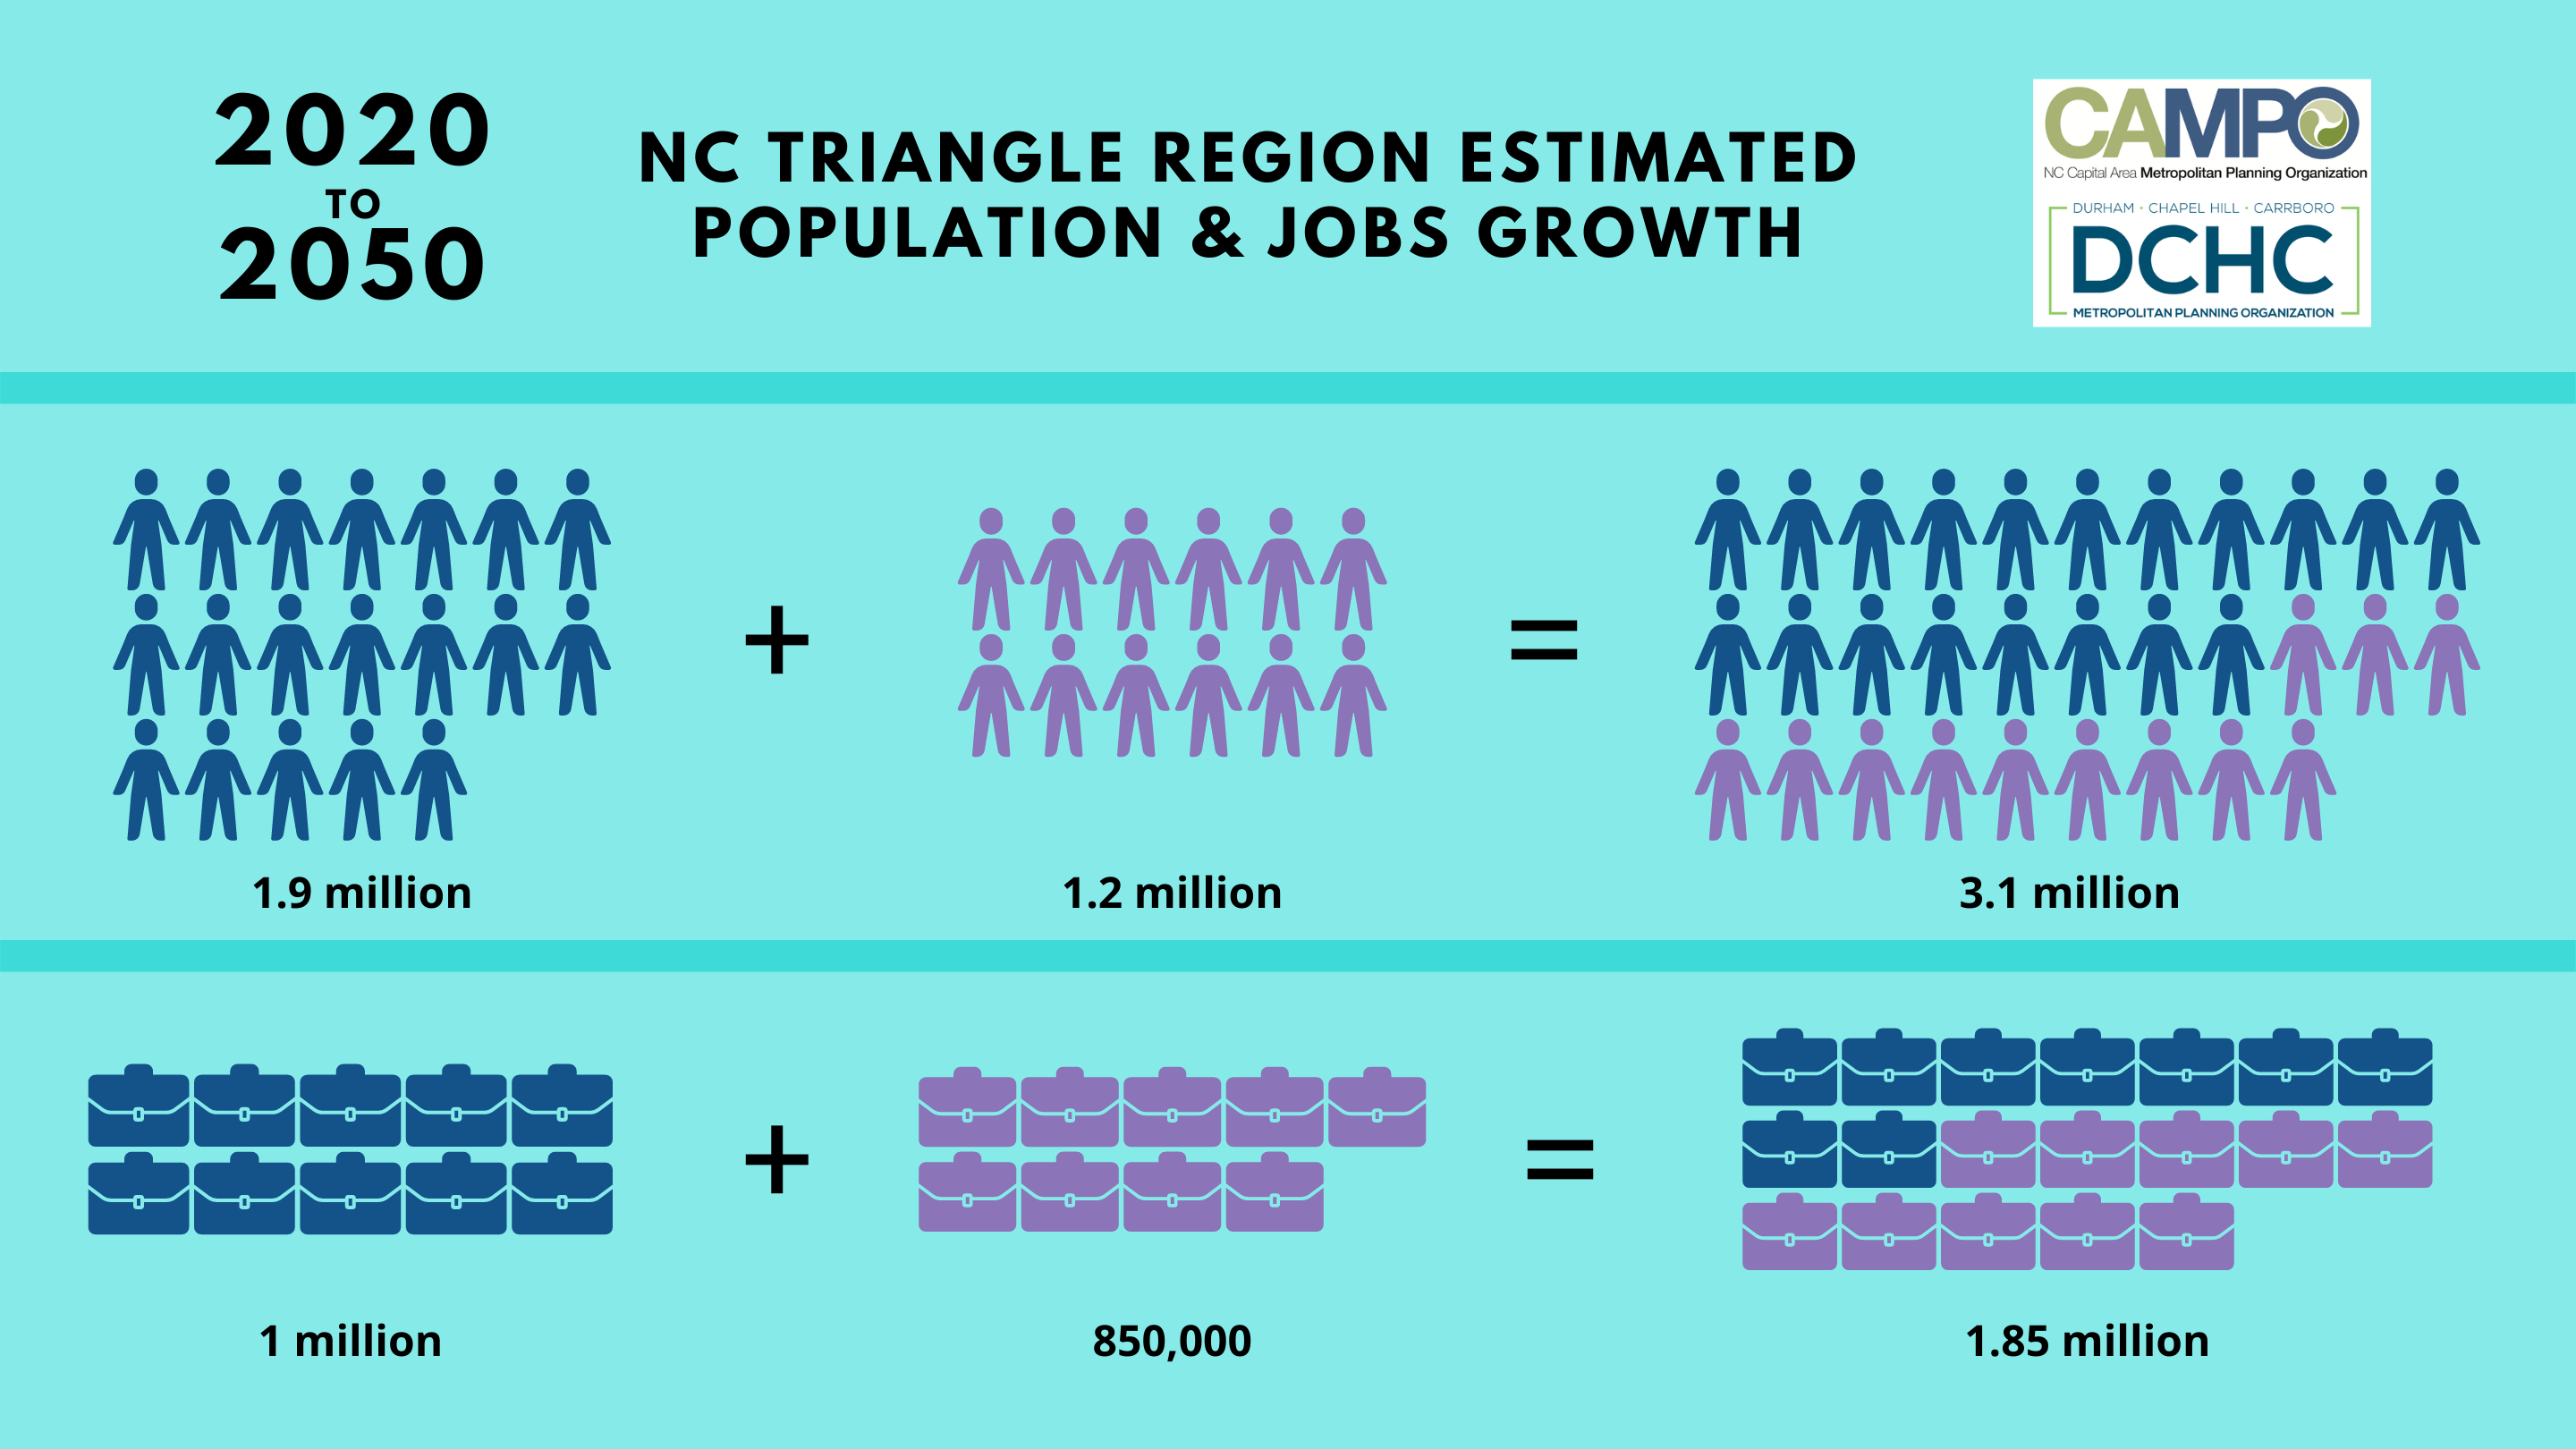
To analyze future transportation investment choices, CAMPO follows a systematic process that begins with understanding how our communities’ plans work to guide their future growth. Community and regional planners, in partnership with NC State Demographer's Office forecast future population and job growth based on market conditions and trends, factors that influence development, and local transportation and land use plans. Based on the forecasts, planners modelled mobility trends, future needs, and impacts on our transportation system to identify potential deficiencies and needs. This deficiency analysis highlights areas for future transportation investments in highways, transit, and other modes to address future mobility demands. It helps to set a baseline for the development and evaluation of the various transportation alternatives to be considered in subsequent steps of the 2055 MTP development.
Learn more about the 2055 MTP's Deficiency Analysis, "The Baseline"
Alternatives Analysis – Evaluate Potential Solutions
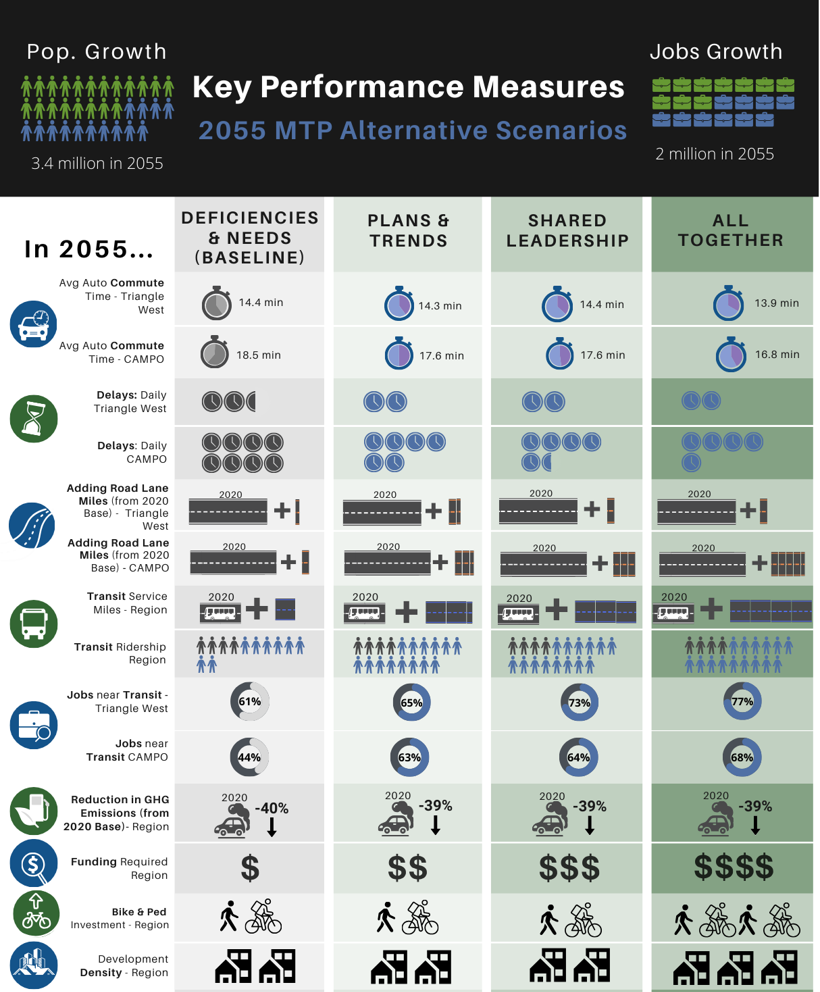
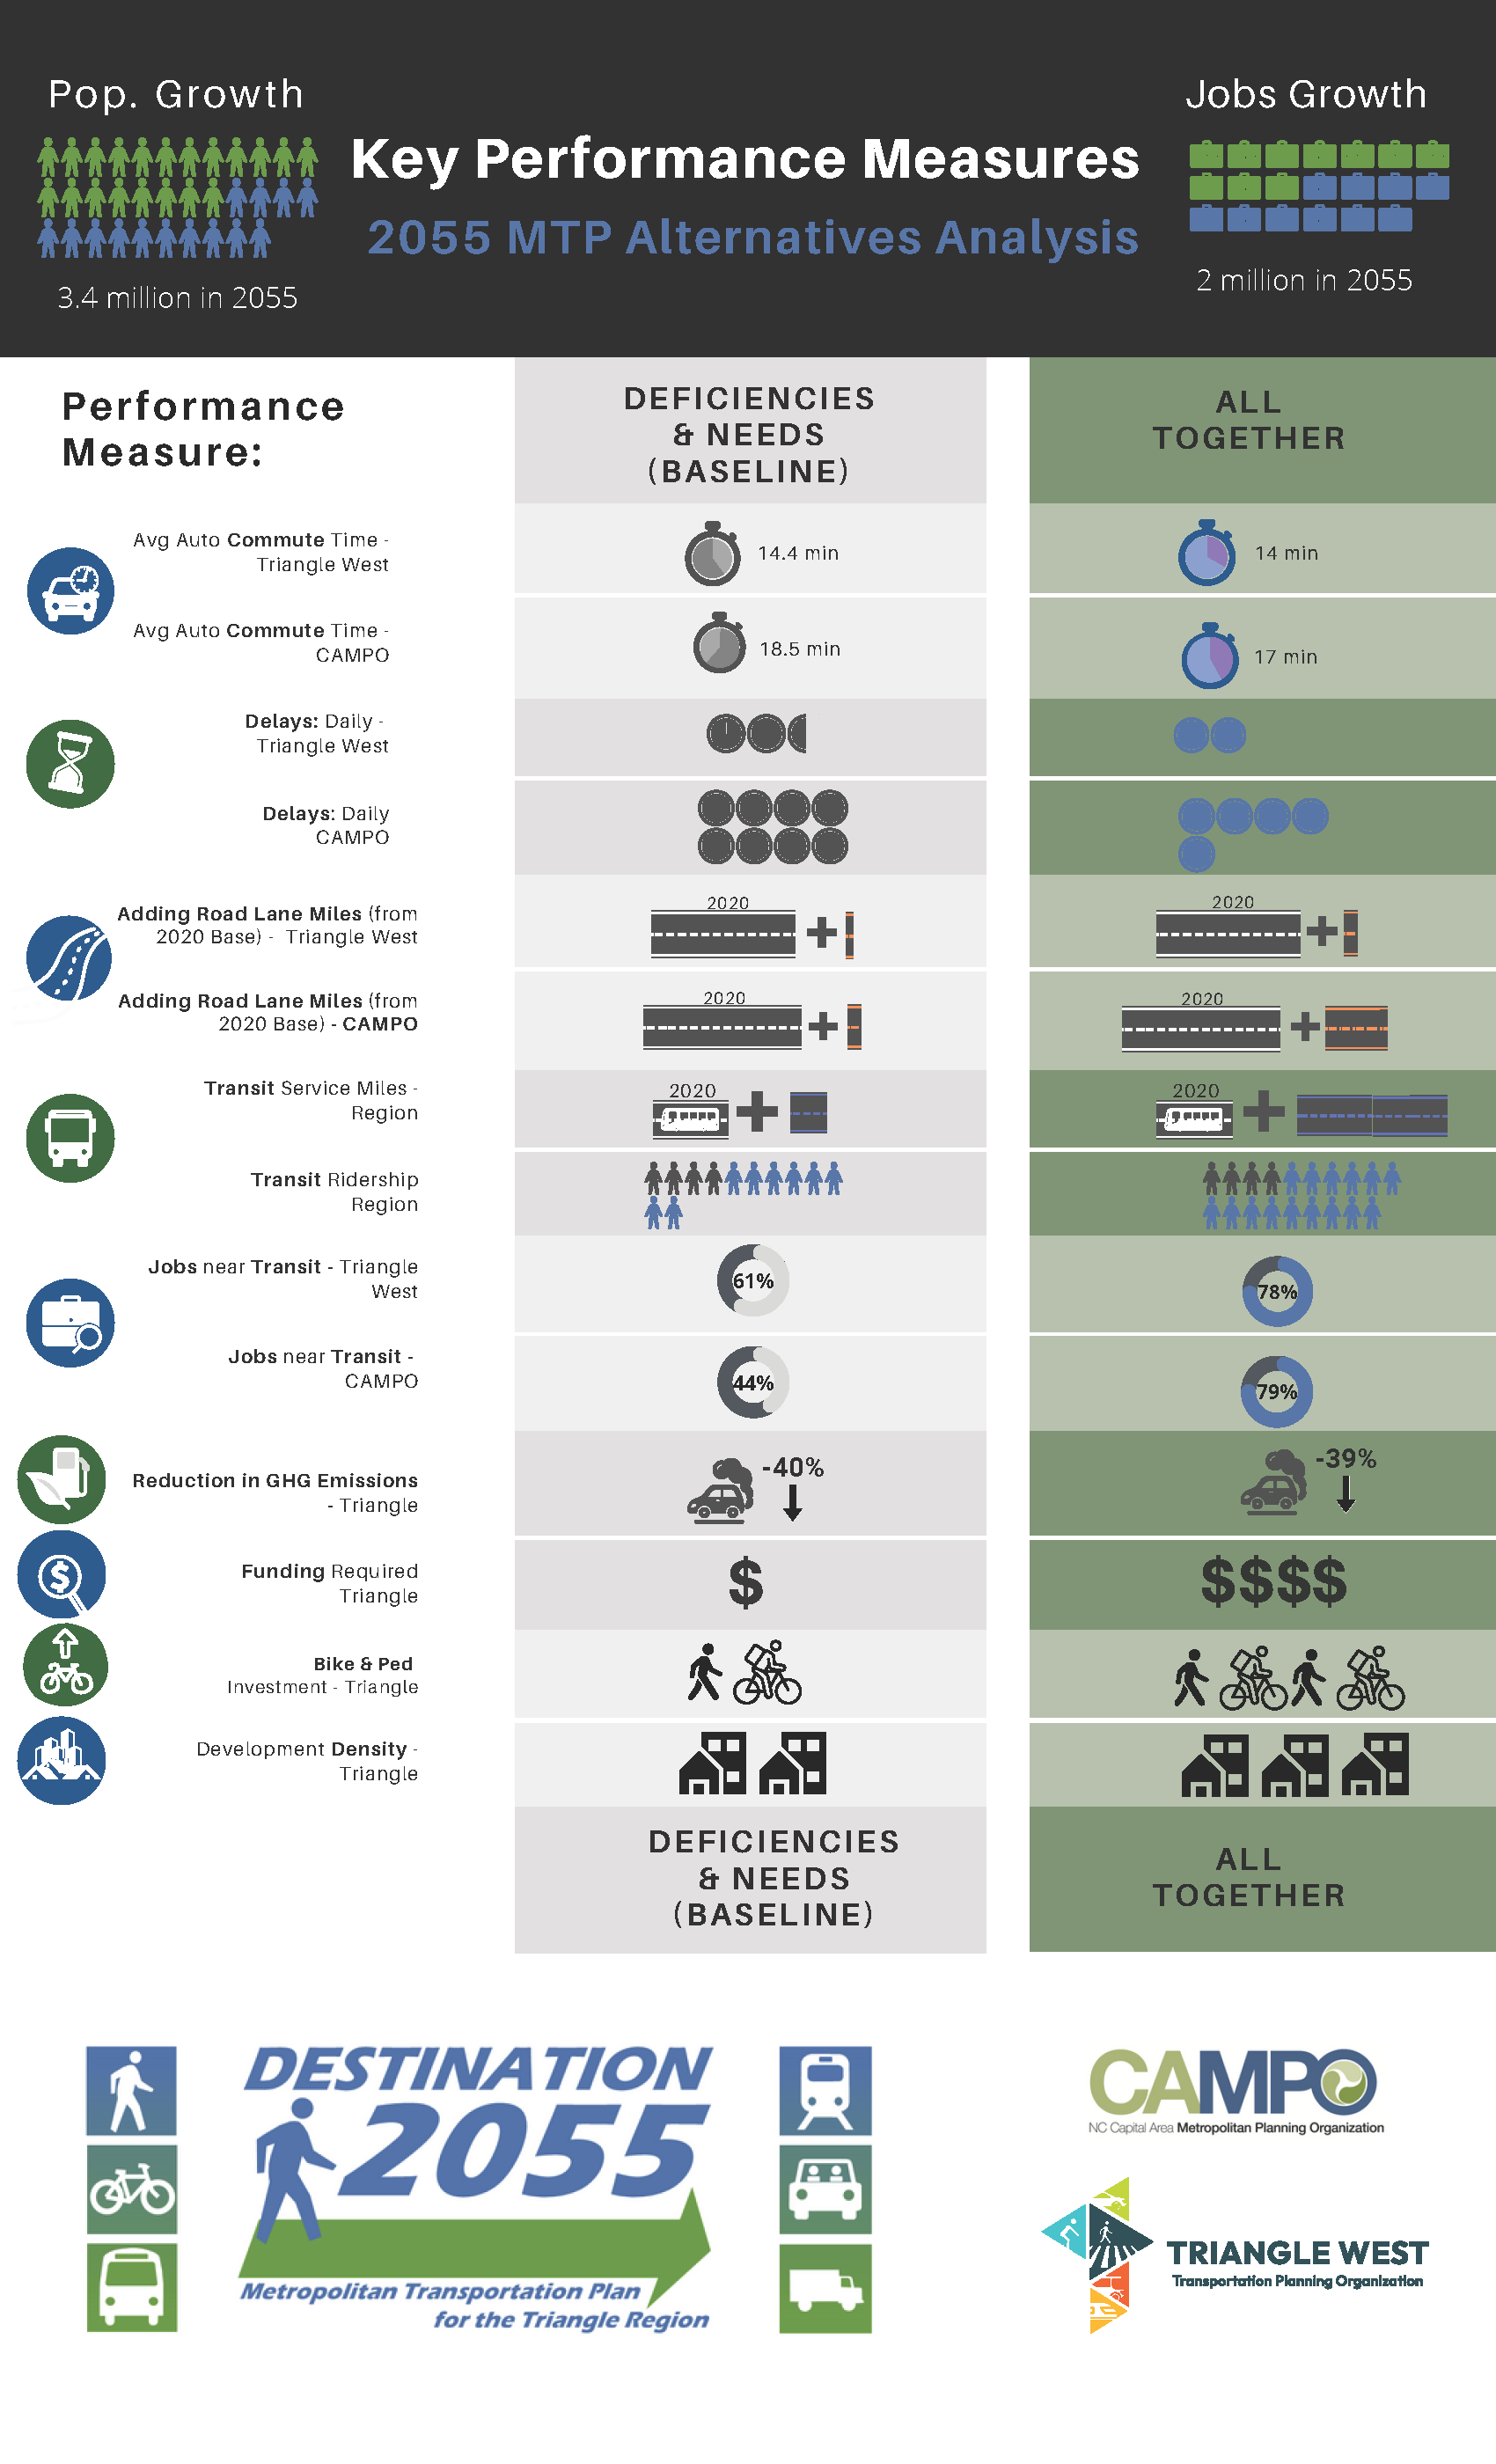
Three (3) transportation system scenarios were developed and modeled. Each modeled scenario was evaluated against performance measures tied to a set of eight (8) goals which were approved by the CAMPO and Triangle West TPO boards. At the conclusion of the alternatives analysis, decisions regarding which scenario attributes to carry forward into a “preferred" plan (similar to a final draft) will be made. Community input is a critical step in providing a public voice during the alternatives analysis phase and helps identify elements from the modeled scenarios that should be emphasized and carried forward into the “preferred” plan.
Public Engagement
Public engagement activities of the alternative analyses took place from mid April through late May 2025. This included sixteen (16) pop-up public information sessions, a robust online survey, and a public comment period. Results from the online survey are being synthesized and will be made available on this webpage soon.
Plans & Trends Scenario
The Plans & Trends Scenario represents the case of what is likely to occur without any changes to existing patterns of transportation funding and investment decisions or land use planning policies. It is created by merging the Community Plans development foundation with the Trend mobility investment foundation. This is the “simplest” alternative to implement, but that does not mean it is “easy” to achieve. This scenario assumes that we can rely on tried-and-true revenue streams and transportation/land use decision-making policies and procedures The first decade of funding and projects are taken from the current Transportation Improvement Program (TIP) for each MPO.
- Dot Density – Household Population and Employment
- Travel Time Forecast Isochrone Maps – AM Inbound
- Travel Time Forecast Isochrone Maps – PM Outbound
- Vehicle Congestion “Tomato” Maps - Combined CAMPO/Triangle TPO Region
- Vehicle Congestion “Tomato” Maps – Daily Peak Period (CAMPO Partner Jurisdictions)
- Angier (2020 Base Year | Angier (2055) Plans & Trends
- Apex (2020) Base Year | Apex (2055) Plans & Trends
- Archer Lodge (2020) Base Year | Archer Lodge (2055) Plans & Trends
- Bunn (2020) Base Year | Bunn (2055) Plans & Trends
- Butner (2020) Base Year | Butner (2055) Plans & Trends
- Cary (2020) Base Year | Cary (2055) Plans & Trends
- Clayton (2020) Base Year | Clayton (2055) Plans & Trends
- Coats (2020) Base Year | Coats (2055) Plans & Trends
- Creedmoor (2020) Base Year | Creedmoor (2055) Plans & Trends
- Franklinton (2020) Base Year | Franklinton (2055) Plans & Trends
- Fuquay-Varina (2020) Base Year | Fuquay-Varina (2055) Plans & Trends
- Garner (2020) Base Year | Garner (2055) Plans & Trends
- Holly Springs (2020) Base Year | Holly Springs (2055) Plans & Trends
- Knightdale (2020) Base Year | Knightdale (2055) Plans & Trends
- Lillington (2020) Base Year | Lillington (2055) Plans & Trends
- Morrisville (2020) Base Year | Morrisville (2055) Plans & Trends
- Raleigh (2020) Base Year | Raleigh (2055) Plans & Trends
- Rolesville (2020) Base Year | Rolesville (2055) Plans & Trends
- Wake Forest (2020) Base Year | Wake Forest (2055) Plans & Trends
- Wendell (2020) Base Year | Wendell (2055) Plans & Trends
- Youngsville (2020) Base Year | Youngsville (2055) Plans & Trends
- Zebulon (2020) Base Year | Zebulon (2055) Plans & Trends
What Years Are Analyzed?
The mobility network performance measures and maps displaying those measures are based on a travel demand model that estimates conditions for three different horizon years: 2035, 2045 and the ultimate build out year of 2055 horizon year that will include all projects that can afford to be built based on trend level funding.
Land Use Assumptions
The future population and employment growth allocation in the region that will impact the transportation network is based on the future development patterns densities identified in adopted local land use plans. Potential Transit Choice Neighborhoods (TCNs) in multi-modal corridors throughout the region have been identified to receive a mixture of higher residential densities and employment space to support the increased transit services.
Highlighted Transportation Projects: Plans & Trends
- Highway Investments:
- Completion of Outer Loop
- Widening/Improving I-40, I-440, US 401, US 1, US 64, US 70, NC 42, NC 50, NC 54, NC 55, NC 98
- Smaller level of secondary roadway investments in second two decades
- Transit Investments:
- Extension of Downtown Cary/Garner Station Bus Rapid Transit (BRT) service to include the Regional Transit Center in RTP and The Town of Clayton/Powhatan;
- Addition of three BRT services (SAS Campus to Regency Park Corporation in Apex, Downtown Raleigh to North Hills and Downtown Raleigh to Triangle Town Center;
- The extent of passenger rail will expand to the towns of Wake Forest and Mebane via the S-Line project
- Addition of regional rail service (from RTC to Downtown Cary to Downtown Raleigh to Wake Forest)
- Regional rail service will operate at a frequency of 4-0-4-0
- Increased intercity passenger rail service (ie…Amtrak) from RUS to Downtown Cary to Downtown Durham to (4-2-4-2)
- In this and other scenarios, the sequence of 4 numbers indicate the # of AM Peak-midday-PM peak-evening trains in each direction
Shared Leadership Scenario
The Shared Leadership scenario can be thought of as a stronger partnership between local governments and state and federal governments, emphasizing multi-modal investments in key corridors, which the scenario terms “Mobility Corridors.” It is created by combining the Opportunity Places development foundation with the Mobility Corridors investment foundation. Communities would reorient land use in specific places and ways to enable more sustainable and efficient travel, with an emphasis on linking equity-centered neighborhoods to major job hubs along the Mobility Corridors. State and federal governments would provide both more funding and more flexibility in the use of said funding to better reflect the priorities of the community. With the recent passage of the federal Infrastructure Investment and Jobs Act (IIJA), the federal government has provided an infusion of funds that is aligned with the Shared Leadership scenario. The NC F1RST Commission has recommended an analogous increase in state funding support and flexibility.
- Dot Density – Household Population and Employment
- Travel Time Forecast Isochrone Maps – AM Inbound
- Travel Time Forecast Isochrone Maps – PM Outbound
- Vehicle Congestion “Tomato” Maps - Combined CAMPO/Triangle TPO Region
- Vehicle Congestion “Tomato” Maps – Daily Peak Period (CAMPO Partner Jurisdictions)
- Angier (2020 Base Year | Angier (2055) Shared Leadership
- Apex (2020) Base Year | Apex (2055) Shared Leadership
- Archer Lodge (2020) Base Year | Archer Lodge (2055) Shared Leadership
- Bunn (2020) Base Year | Bunn (2055) Shared Leadership
- Butner (2020) Base Year | Butner (2055) Shared Leadership
- Cary (2020) Base Year | Cary (2055) Shared Leadership
- Clayton (2020) Base Year | Clayton (2055) Shared Leadership
- Coats (2020) Base Year | Coats (2055) Shared Leadership
- Creedmoor (2020) Base Year | Creedmoor (2055) Shared Leadership
- Franklinton (2020) Base Year | Franklinton (2055) Shared Leadership
- Fuquay-Varina (2020) Base Year | Fuquay-Varina (2055) Shared Leadership
- Garner (2020) Base Year | Garner (2055) Shared Leadership
- Holly Springs (2020) Base Year | Holly Springs (2055) Shared Leadership
- Knightdale (2020) Base Year | Knightdale (2055) Shared Leadership
- Lillington (2020) Base Year | Lillington (2055) Shared Leadership
- Morrisville (2020) Base Year | Morrisville (2055) Shared Leadership
- Raleigh (2020) Base Year | Raleigh (2055) Shared Leadership
- Rolesville (2020) Base Year | Rolesville (2055) Shared Leadership
- Wake Forest (2020) Base Year | Wake Forest (2055) Shared Leadership
- Wendell (2020) Base Year | Wendell (2055) Shared Leadership
- Youngsville (2020) Base Year | Youngsville (2055) Shared Leadership
- Zebulon (2020) Base Year | Zebulon (2055) Shared Leadership
What Years Are Analyzed?
The mobility network performance measures and maps displaying those measures are based on a travel demand model that estimates conditions for three different horizon years: 2035, 2045 and the ultimate build out year of 2055 that will include all projects that can afford to be built based on higher levels of funding investment compared to the Plans and Trends scenario.
Land Use Assumptions
The future population and employment growth allocation in the region that will impact the transportation network is based on the future development patterns densities identified in adopted local land use plans. Potential Transit Choice Neighborhoods (TCNs) in multi-modal corridors throughout the region have been identified to receive a mixture of higher residential densities and employment space to support the increased transit services. There is also a reduction in the number of employment trips to reflect recent patterns of remote/teleworking in the region.
Highlighted Transportation Projects: Shared Leadership
- Highway Investments:
- Same investments from the Plans and Trends Scenario
- Transit Investments:
- Same BRT investments from Plans and Trends
- The extent of passenger rail same as Plans and Trends
- The extent of regional rail will expand beyond scope of Plans and Trends to include termini at Apex and Garner.
- Intercity passenger rail service will match Plans and Trends (4-2-4-2)
- Regional rail service will operate at the same frequency as Plans and Trends (4-0-4-0), but the Shared Leadership scenario also includes a stop in the Town of Morrisville
All Together Scenario
The All Together scenario is the region’s most ambitious scenario. It is based on the same Opportunity Places development foundation as the Shared Leadership scenario, but also requires added flexibility in state revenue sources. This scenario further relies on increased local tax revenues in order to fund additional transit, active transportation, and complete street investments as outlined in the Complete Communities mobility investment foundation.
- Dot Density – Household Population and Employment
- Travel Time Forecast Isochrone Maps – AM Inbound
- Travel Time Forecast Isochrone Maps – PM Outbound
- Vehicle Congestion “Tomato” Maps - Combined CAMPO/Triangle TPO Region
- Vehicle Congestion “Tomato” Maps – Daily Peak Period (CAMPO Partner Jurisdictions)
- Angier (2020 Base Year | Angier (2055) All Together
- Apex (2020) Base Year | Apex (2055) All Together
- Archer Lodge (2020) Base Year | Archer Lodge (2055) All Together
- Bunn (2020) Base Year | Bunn (2055) All Together
- Butner (2020) Base Year | Butner (2055) All Together
- Cary (2020) Base Year | Cary (2055) All Together
- Clayton (2020) Base Year | Clayton (2055) All Together
- Coats (2020) Base Year | Coats (2055) All Together
- Creedmoor (2020) Base Year | Creedmoor (2055) All Together
- Franklinton (2020) Base Year | Franklinton (2055) All Together
- Fuquay-Varina (2020) Base Year | Fuquay-Varina (2055) All Together
- Garner (2020) Base Year | Garner (2055) All Together
- Holly Springs (2020) Base Year | Holly Springs (2055) All Together
- Knightdale (2020) Base Year | Knightdale (2055) All Together
- Lillington (2020) Base Year | Lillington (2055) All Together
- Morrisville (2020) Base Year | Morrisville (2055) All Together
- Raleigh (2020) Base Year | Raleigh (2055) All Together
- Rolesville (2020) Base Year | Rolesville (2055) All Together
- Wake Forest (2020) Base Year | Wake Forest (2055) All Together
- Wendell (2020) Base Year | Wendell (2055) All Together
- Youngsville (2020) Base Year | Youngsville (2055) All Together
- Zebulon (2020) Base Year | Zebulon (2055) All Together
What Years Are Analyzed?
The mobility network performance measures and maps displaying those measures are based on a travel demand model that estimates conditions for three different horizon years: 2035, 2045 and the ultimate build-out year of 2055 that will include all projects that can afford to be built based on higher levels of funding investment compared to the Shared Leadership scenario.
Land Use Assumptions
The future population and employment growth allocation in the region that will impact the transportation network is based on the future development pattern densities identified in adopted local land use plans with the following modifications:
- Anchor institutions (universities) – increased asserted development
- Mobility hubs – more intense, mixed-use development in ~2 dozen places; largely at previously identified “activity centers” in CommunityViz
- Frequent transit corridors (Travel Choice Neighborhoods) – TOD development on developable parcels
- Affordable housing opportunity sites – asserted “LIHTC-like” projects on undeveloped public land through GIS-based criteria
Highlighted Transportation Projects: All Together
- Highway Investments:
- Same investments from the Plans and Trends and Shared Leadership Scenarios with a higher level of secondary roadway investments in second two decades – this will require additional revenue assumptions compared to other scenarios
- Transit Investments:
- Same BRT investments from Plans and Trends and Shared Leadership
- The extent of passenger rail is the same as in the Plans and Trends and Shared Leadership scenarios
- Intercity passenger rail service will match Plans and Trends (4-2-4-2)
- Regional rail service under the All Together scenario will operate at an expanded frequency of (6-2-6-2) as compared to the Plans and Trends (4-0-4-0) and Shared Leadership scenarios. The All Together scenario will also include the Town of Morrisville stop included in Shared Leadership.
- In Shared Leadership the extent of regional rail would expand beyond scope of Plans and Trends to include termini at Apex and Garner. In All Together these extents are extended:
- Town of Wake Forest termini extended to the Town of Franklinton
- Regional Transit Center termini in Research Triangle Park extended to the Town of Hillsborough
- Town of Apex is extended to the massive future Veridea development
- Town of Garner termini is extended to the Town of Selma
Preferred Scenario
In June of 2025, the CAMPO Executive Board gave guidance to develop the “Preferred Scenario” based on the above's “All Together” scenario as studied during the 2055 MTP’s Alternative Analysis. As of early August 2025, CAMPO staff - working alongside staff from CPRC and Triangle West TPO - and in coordination with our local jurisdictional partners have updated and refined the project lists across all modes associated with the original "All Together" scenario. The addition of some new projects and the refinement of previously existing projects in the Triangle Regional Model has altered the way in which some aspects of the transportation network behave within the thirty-year planning horizon. The following maps give both a detailed and overarching view of these changes. The next step in the development of the Preferred Scenario is to fiscally constrain the projects included in this “All Together” scenario to develop said “Preferred Scenario”. Once those appropriate projects have been either removed completely or more likely shifted to the horizon of the Comprehensive Transportation Plan, a new set of maps and other scoring deliverables will be produced as we work towards the production of a draft 2055 MTP.
- Dot Density – Household Population and Employment
- Travel Time Forecast Isochrone Maps – AM Inbound
- Travel Time Forecast Isochrone Maps – PM Outbound
- Vehicle Congestion “Tomato” Maps - Combined CAMPO/Triangle TPO Region
- Vehicle Congestion “Tomato” Maps – Daily Peak Period (CAMPO Partner Jurisdictions)
- Angier (2020 Base Year | Angier (2055) Preferred
- Apex (2020) Base Year | Apex (2055) Preferred
- Archer Lodge (2020) Base Year | Archer Lodge (2055) Preferred
- Bunn (2020) Base Year | Bunn (2055) Preferred
- Butner (2020) Base Year | Butner (2055) Preferred
- Cary (2020) Base Year | Cary (2055) Preferred
- Clayton (2020) Base Year | Clayton (2055) Preferred
- Coats (2020) Base Year | Coats (2055) All Preferred
- Creedmoor (2020) Base Year | Creedmoor (2055) Preferred
- Franklinton (2020) Base Year | Franklinton (2055) All Together
- Fuquay-Varina (2020) Base Year | Fuquay-Varina (2055) Preferred
- Garner (2020) Base Year | Garner (2055) Preferred
- Holly Springs (2020) Base Year | Holly Springs (2055) Preferred
- Knightdale (2020) Base Year | Knightdale (2055) Preferred
- Lillington (2020) Base Year | Lillington (2055) Preferred
- Morrisville (2020) Base Year | Morrisville (2055) Preferred
- Raleigh (2020) Base Year | Raleigh (2055) Preferred
- Rolesville (2020) Base Year | Rolesville (2055) Preferred
- Wake Forest (2020) Base Year | Wake Forest (2055) Preferred
- Wendell (2020) Base Year | Wendell (2055) Preferred
- Youngsville (2020) Base Year | Youngsville (2055) Preferred
- Zebulon (2020) Base Year | Zebulon (2055) Preferred
Visit the Maps & Data page for additional information on the analyses.
Developing the "Preferred" Scenario
What is the Preferred Scenario?
The Preferred Scenario (based upon the All Together scenario from the Alternative Scenario analysis) increases the intensity and mix of land uses at major employment hubs and travel corridors, and works to link our community to jobs through varied modes of transport. It increases biking and walking facilities and provides transit services in major commuting corridors and major activity centers. It assumes several future transportation funding changes on the state and local level, which means both housing affordability and transportation funding actions by a range of partners would be necessary. It also assumes that a larger proportion of residential and employment development occurs in the corridors served by bus, Bus Rapid Transit (BRT), regional rail, and bicycle and pedestrian facilities. This scenario includes the highest density with mixed use land development, which increases transit usage to reduce Vehicle Miles Traveled. It also has the highest funding level among the alternative scenarios that were compared.
Landmarks in Developing the Preferred Scenario
All Together Scenario - Vehicle Congestion - Daily Peak Period (2055)
In the spring of 2025, three Alternative Scenarios were developed and brought out to the community through a comprehensive public engagement effort. Of those alternatives the most robust in project development and funding was the "All Together" scenario. In June 2025, this scenario was selected by CAMPO's governing bodies to be the basis of the 2055 MTP "Preferred Scenario".
Preferred Scenario - Vehicle Congestion - Daily Peak Period (2055)
Over the next two months, CAMPO staff - working alongside staff from CPRC and Triangle West TPO - and in coordination with our local jurisdictional partners updated and refined the project lists across all modes associated with the original "All Together" scenario. The addition of some new projects and the refinement of previously existing projects in the Triangle Regional Model altered the way in which some aspects of the transportation network behaved within the thirty-year planning horizon. Updated mapping and public engagement materials were developed and a second public engagement effort was conducted to gather any additional feedback from staff, stakeholders and the general public.
Public Engagement
Public engagement activities of the Preferred Scenario analysis concluded on August 10, 2025. View the comments received here.
The following maps were developed prior to the fiscal constraint analysis, and represent the list of projects in the Preferred Scenario's impact on the efficacy of the tranpsortation network through 2055.
- Dot Density – Household Population and Employment
- Travel Time Forecast Isochrone Maps – AM Inbound
- Travel Time Forecast Isochrone Maps – PM Outbound
- Vehicle Congestion “Tomato” Maps - Combined CAMPO/Triangle TPO Region
- Vehicle Congestion “Tomato” Maps – Daily Peak Period (CAMPO Partner Jurisdictions)
- Angier (2020 Base Year | Angier (2055) Preferred
- Apex (2020) Base Year | Apex (2055) Preferred
- Archer Lodge (2020) Base Year | Archer Lodge (2055) Preferred
- Bunn (2020) Base Year | Bunn (2055) Preferred
- Butner (2020) Base Year | Butner (2055) Preferred
- Cary (2020) Base Year | Cary (2055) Preferred
- Clayton (2020) Base Year | Clayton (2055) Preferred
- Coats (2020) Base Year | Coats (2055) All Preferred
- Creedmoor (2020) Base Year | Creedmoor (2055) Preferred
- Franklinton (2020) Base Year | Franklinton (2055) All Together
- Fuquay-Varina (2020) Base Year | Fuquay-Varina (2055) Preferred
- Garner (2020) Base Year | Garner (2055) Preferred
- Holly Springs (2020) Base Year | Holly Springs (2055) Preferred
- Knightdale (2020) Base Year | Knightdale (2055) Preferred
- Lillington (2020) Base Year | Lillington (2055) Preferred
- Morrisville (2020) Base Year | Morrisville (2055) Preferred
- Raleigh (2020) Base Year | Raleigh (2055) Preferred
- Rolesville (2020) Base Year | Rolesville (2055) Preferred
- Wake Forest (2020) Base Year | Wake Forest (2055) Preferred
- Wendell (2020) Base Year | Wendell (2055) Preferred
- Youngsville (2020) Base Year | Youngsville (2055) Preferred
- Zebulon (2020) Base Year | Zebulon (2055) Preferred
Visit the Maps & Data page for additional information on the analyses.
Developing the Draft 2055 MTP
The Draft 2055 MTP
Draft 2055 MTP: Roadway Project List and Maps
Draft 2055 MTP: Roadway Project List
Draft 2055 MTP: Roadway By Horizon
Draft 2055 MTP: Roadway By Improvement Type
Bicycle & Pedestrian Maps
Draft 2055 MTP: Bicycle & Pedestrian Improvements By Facility Type
Draft 2055 MTP: Bicycle & Pedestrian Improvements By Mode
Draft 2055 MTP: Bicycle & Pedestrian Improvements By Tier
Transit Maps
Draft 2055 MTP: Transit Network
Upon completion of the Fiscal Constraint analysis of the Preferred Scenario, the above project list and subsequent maps were developed to reflect the fiscal constraint methodology recommended by the CAMPO governing bodies. At that point they became the Draft 2055 MTP.