2050 MTP Alternative Scenarios - Archive
The Destination 2055 MTP was approved by the CAMPO Executive Board in February of 2026. Information about the approved 2050 MTP and its development process contained in the webpage below contains archived content from images to files that may not meet current accessibility requirements.
View the Preferred Scenario - Interactive Map
The Alternative Future Scenarios Phase was completed in September of 2021. The following explains the process that took place during that phase.
Alternatives Analysis – What are our Future Needs?
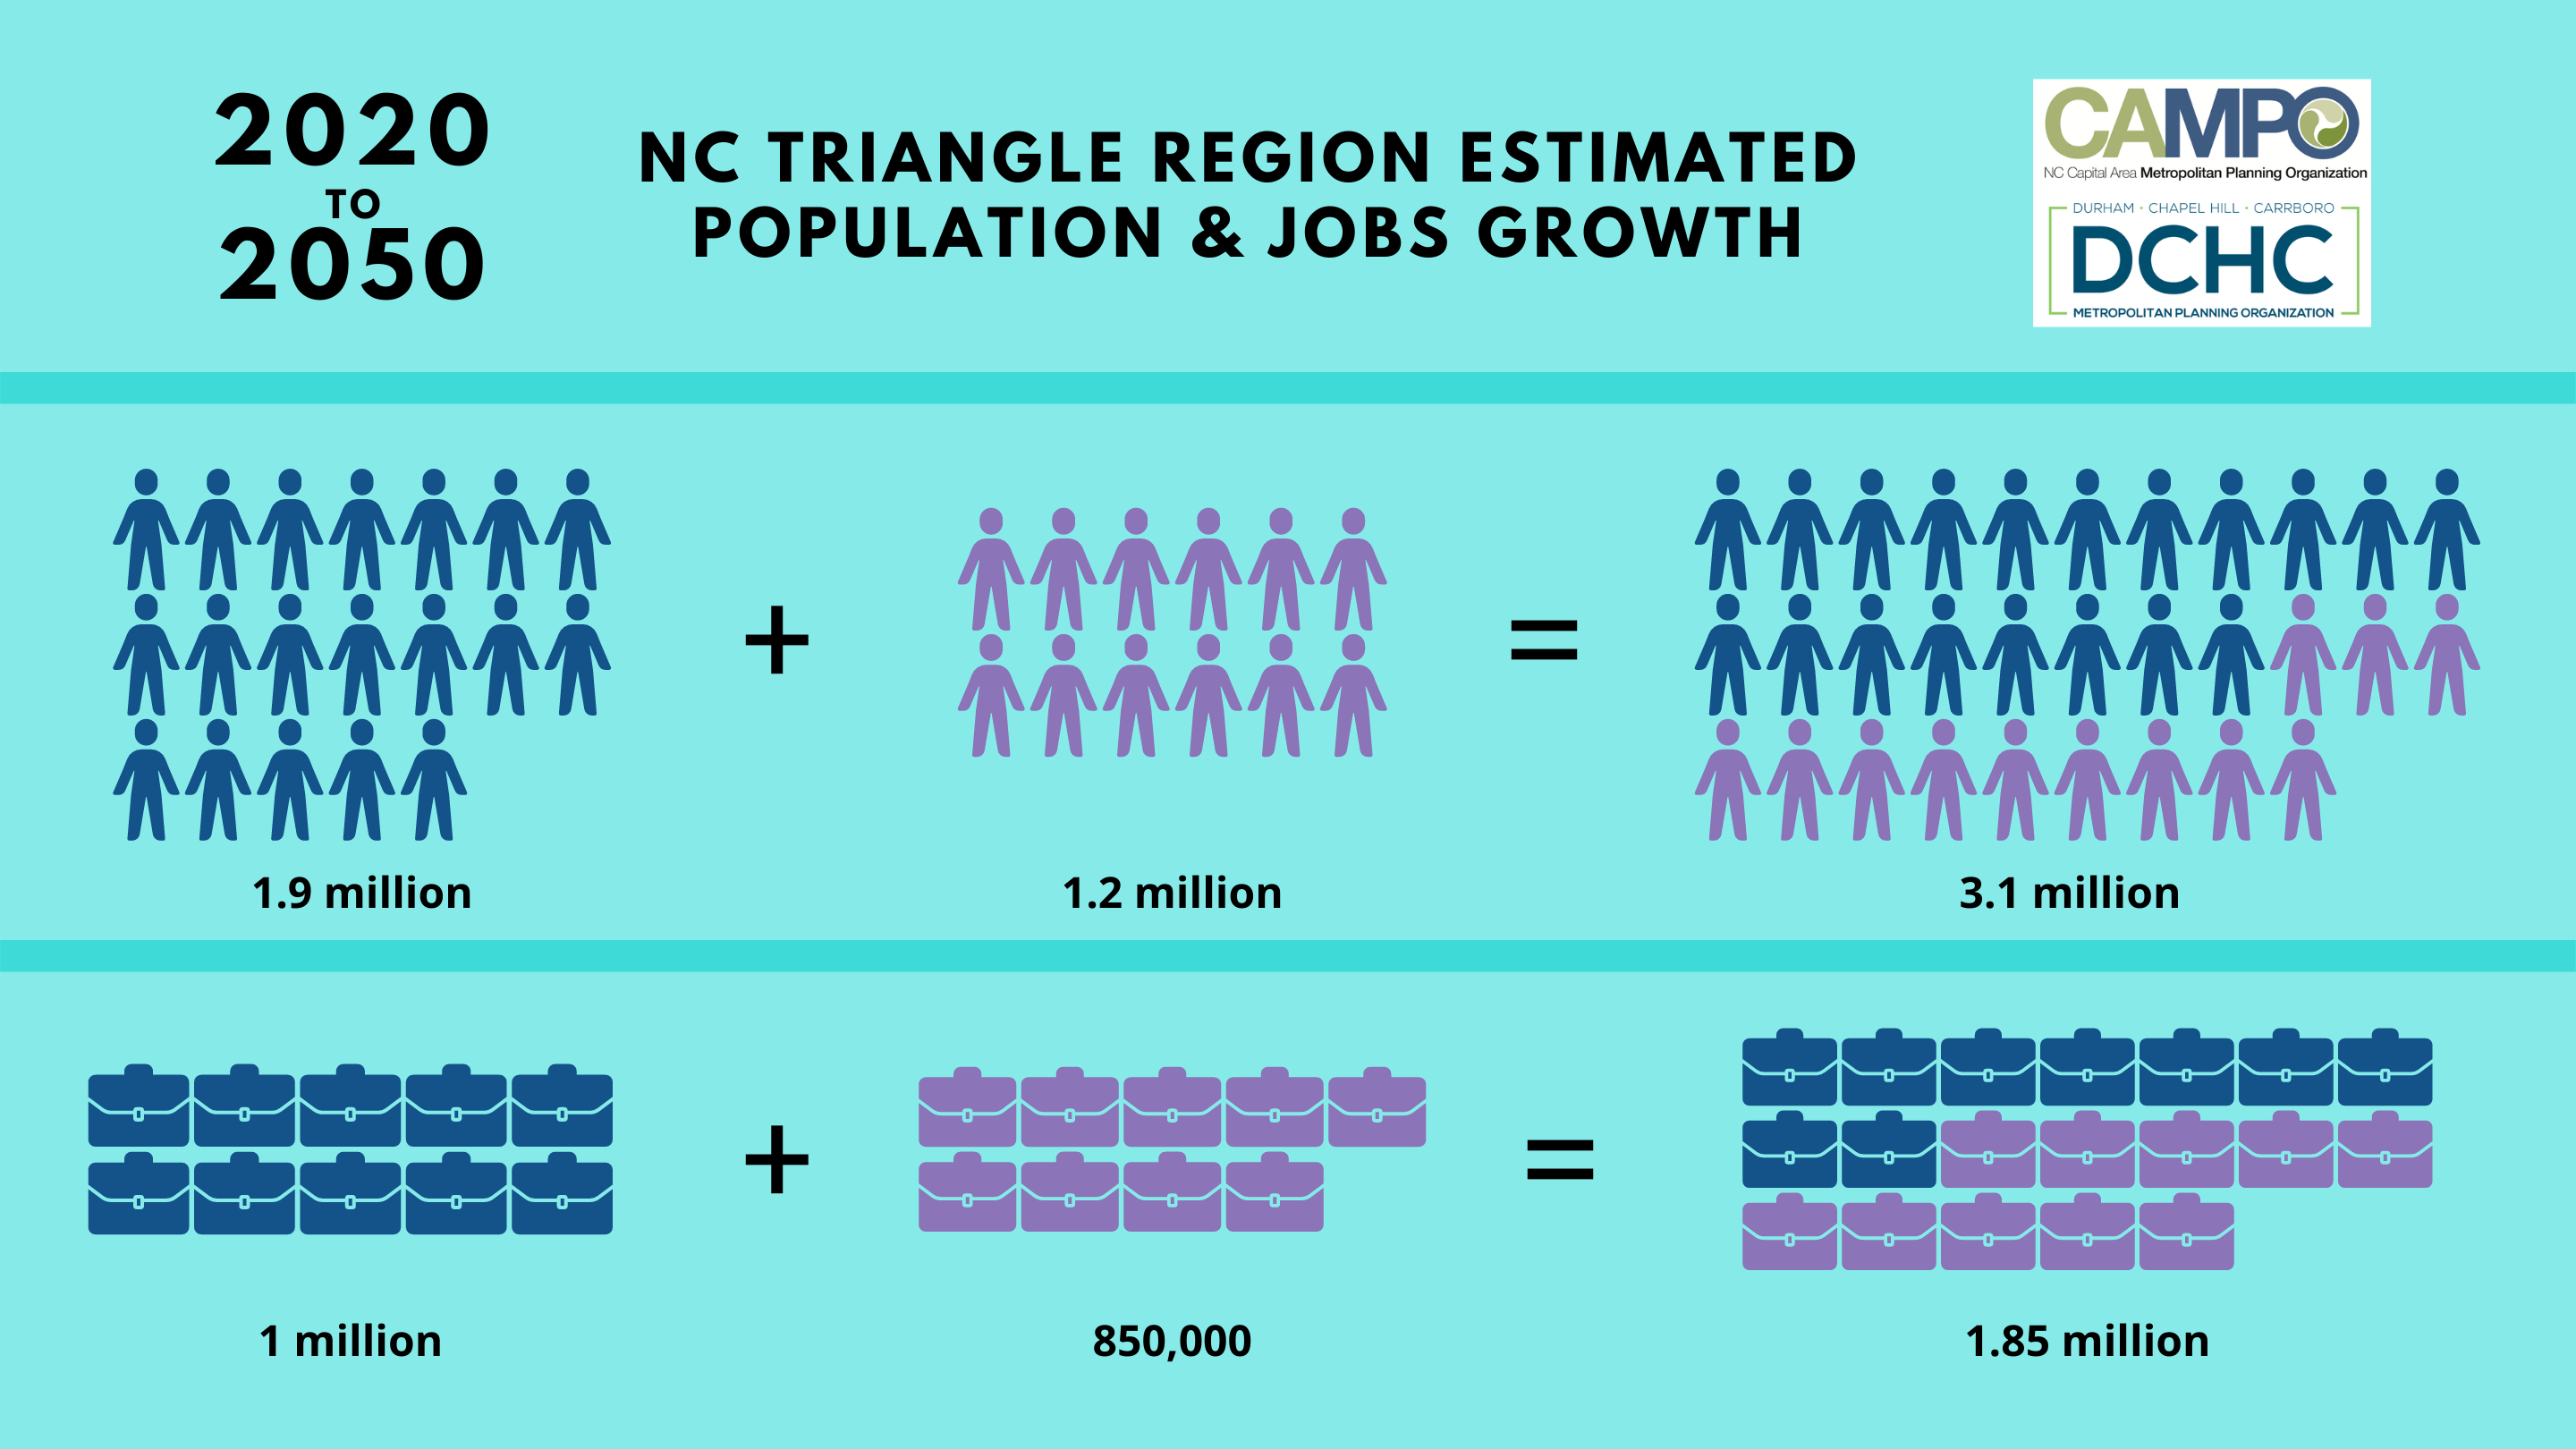
To analyze future transportation investment choices, CAMPO followed a systematic process that began with an understanding of how our communities’ plans guide future growth. Planners forecasted future population and job growth based on market conditions and trends, factors that influence development, and local transportation and land use plans. Based on the forecasts, planners modelled mobility trends, future needs, and impacts on our transportation system to identify potential deficiencies and needs. This deficiency analysis highlights areas for future transportation investments in highways, transit, and other modes to address future mobility demands. It helps to set a baseline for the development and evaluation of the various transportation alternatives to be considered in subsequent steps of the 2050 MTP development.
Learn more about the 2050 MTP's Deficiency Analysis, "The Baseline"
Alternatives Analysis – Evaluate Potential Solutions
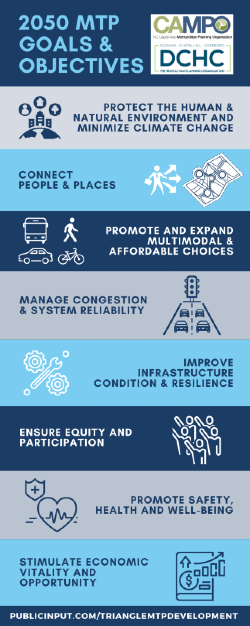
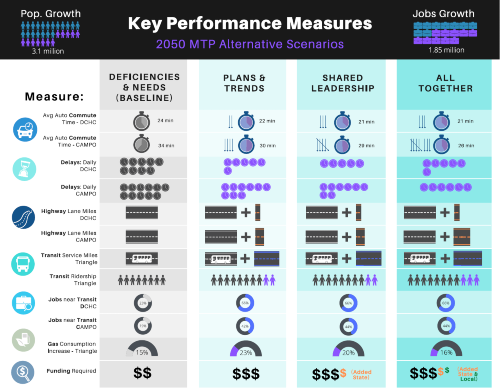
Three (3) transportation system scenarios were developed and modeled. Each modeled scenario was evaluated against performance measures tied to a set of eight (8) goals which were approved by the CAMPO and DCHC MPO Boards. At the conclusion of the alternatives analysis, decisions regarding which scenario attributes to carry forward into a “preferred’ plan (similar to a final draft) will be made. Community input is a critical step in providing a public voice during the alternatives analysis phase and helps identify elements from the modeled scenarios that should be emphasized and carried forward to the “preferred” plan.
Public Engagement
Public engagement activities took place from late July through August of 2021. This included two public information sessions, an online survey, and a public comment period. Results from the online survey are being synthesized and will be made available on this webpage soon.
- Public Info Sessions - Recording and Presentation Slides (August 2021)
- Summary of Scenarios (Handout - PDF)
- Summary Table of Key Performance Measures
- Survey Comments - ALL
Plans & Trends Scenario
The Plans & Trends Scenario includes all transportation projects in the baseline scenario, and adds projects identified in recent local and regional transportation plan updates and studies. All are able to be funded from existing revenue sources and adhere to current funding source rules. The first decade of funding and projects are taken from the current Transportation Improvement Program (TIP) for each MPO.
Highlights - Plans & Trends Scenario
- The Plans & Trends scenario provides a substantial increase in highway miles and an almost two-fold increase in transit service over the Deficiency & Needs scenario.
- Commuter Rail Transit (CRT), West Durham-Raleigh-Clayton at low service level (8 peak period trains and 2 non-peak period trains)
- Bus Rapid Transit (BRT) North-South through Cary
- Additions to local and regional bus connections based on the Wake Transit Plan
- Additional highway projects by 2025, e.g. Complete NC 540 from I-40 to U.S. 64
- Some additional secondary roadway investments
Shared Leadership Scenario
The Shared Leadership scenario increases the intensity and mix of land uses at major employment hubs and travel corridors plus additional roadway and transit along corridors linking areas with concentrations of minority, low-income, and zero-car households to jobs. It assumes additional transportation funding for transit facilities/services and roadway improvements similar to the Plans & Trends scenario. It would require funding changes by state partners in addition to actions that can be taken by the MPOs and local governments, i.e. it assumes that a larger proportion of the overall state and federal funding is available for BRT and rail transit.
Highlights - Shared Leadership Scenario
- The Shared Leadership scenario assumes increased transit service and roadway miles over the Plans & Trends scenario, which decreases congestion.
- CRT West Durham-Raleigh-Clayton at higher service level (12 peak period trains + 8 non-peak trains)
- CRT from Apex to Youngsville
- Includes highway projects to be constructed by 2025, e.g., Complete 540
- Some additional secondary roadway investments
All Together Scenario
The All Together scenario increases the intensity and mix of land uses at major employment hubs and travel corridors, and works to link minority, low-income, and zero-car households to jobs. It increases biking and walking facilities and provides transit services in major commuting corridors. In addition to the funding changes within the Shared Leadership scenario, housing affordability and transportation funding actions by a range of partners would be necessary. It assumes that a larger proportion of residential and employment development occurs in the corridors served by bus, BRT, CRT, and bicycle and pedestrian facilities.
Highlights - All Together Scenario:
- The All Together scenario includes the highest density with mixed use land development, which increases transit usage to reduce Vehicle Miles Traveled. However, Vehicle Miles Traveled and Travel Times only change slightly when compared to other scenarios. This scenario has the highest funding level.
- CRT from Mebane to Selma
- CRT from Apex to Franklinton
- Shift more roadway funding to maintenance
- High level of complete street investments: bus shelters, stop access, and bicycle facilities
- Add connector roads to help create more grid networks and increase bike and pedestrian access
- Bus advantage improvements for BRT
- Higher level of secondary roadway investments in 2030s-2040s
Visit the Maps & Data page for additional information on the analyses, and take the Alternatives Survey before August 29, 2021.
View the August 19, 2021 Public Info Session Recording and Presentation Slides.